Theator Research Hub
Every Operation You Record
Is a Dataset.
The Research Hub pairs you with an AI research partner that works on your own annotated surgical video, your clinical data and the published literature — and carries a study from question to submitted manuscript.
The Problem
Three Things Stand Between a Good
Clinical Question and a Published Paper.
Time is the one everyone names. It is rarely the only one holding the study up.
REACHING THE DATA
The Answer Is Already in the Hospital
Spread across the EHR, the operative note, and hours of recorded surgery nobody has time to review. So what gets measured is whatever someone remembered to write down after the case.
THE COST OF ONE ITERATION
Every Loop Costs Weeks
Assemble the cohort by hand, chase the labs across systems, re-extract when the inclusion criteria move, wait on a statistician — then start over when a reviewer asks something new.
THE RESEARCH PARTNER
Four Specialists, Rarely Free at Once
A serious study needs a data scientist, a biostatistician, a clinician and a medical writer. Very few teams have all four — and almost nobody has them available at the same moment.
Your Data, Supercharged by AI
Surgery You Can Query.
Theator turns your own recorded operations into structured surgical fact. Every recorded case is annotated automatically — and across the 21 procedures Theator models in depth, that annotation goes down to individual surgical steps and intra-operative events, with the timings between them. These are measurements that exist in no EHR field and in no operative note, and they are unique to your hospital because they came from your operations.
Your Theator library
the layer only you haveRecorded cases annotated automatically into intra-operative events, and — across the procedures Theator models in depth — into surgical steps and the timings between them.
Your internal clinical data
Demographics and comorbidities, pre-op state and baseline labs, intraoperative detail, index-admission outcomes, the post-operative course with complications graded Clavien–Dindo and dated by post-operative day, pathology, and pre-computed follow-up measures — joined to the same cases.
Your own files
Spreadsheets loaded as working tables you can analyze; documents kept as reading material the assistant draws on.
The published literature
Searched and cited as you go, so the work is positioned against the evidence.
All four in one place, natively. The assistant reads them inside the same application — no export, no data pull, no separate BI tool, no analyst in the middle. That is why a measurement can come from what the video shows happened, rather than from free text written from memory afterwards.
Research
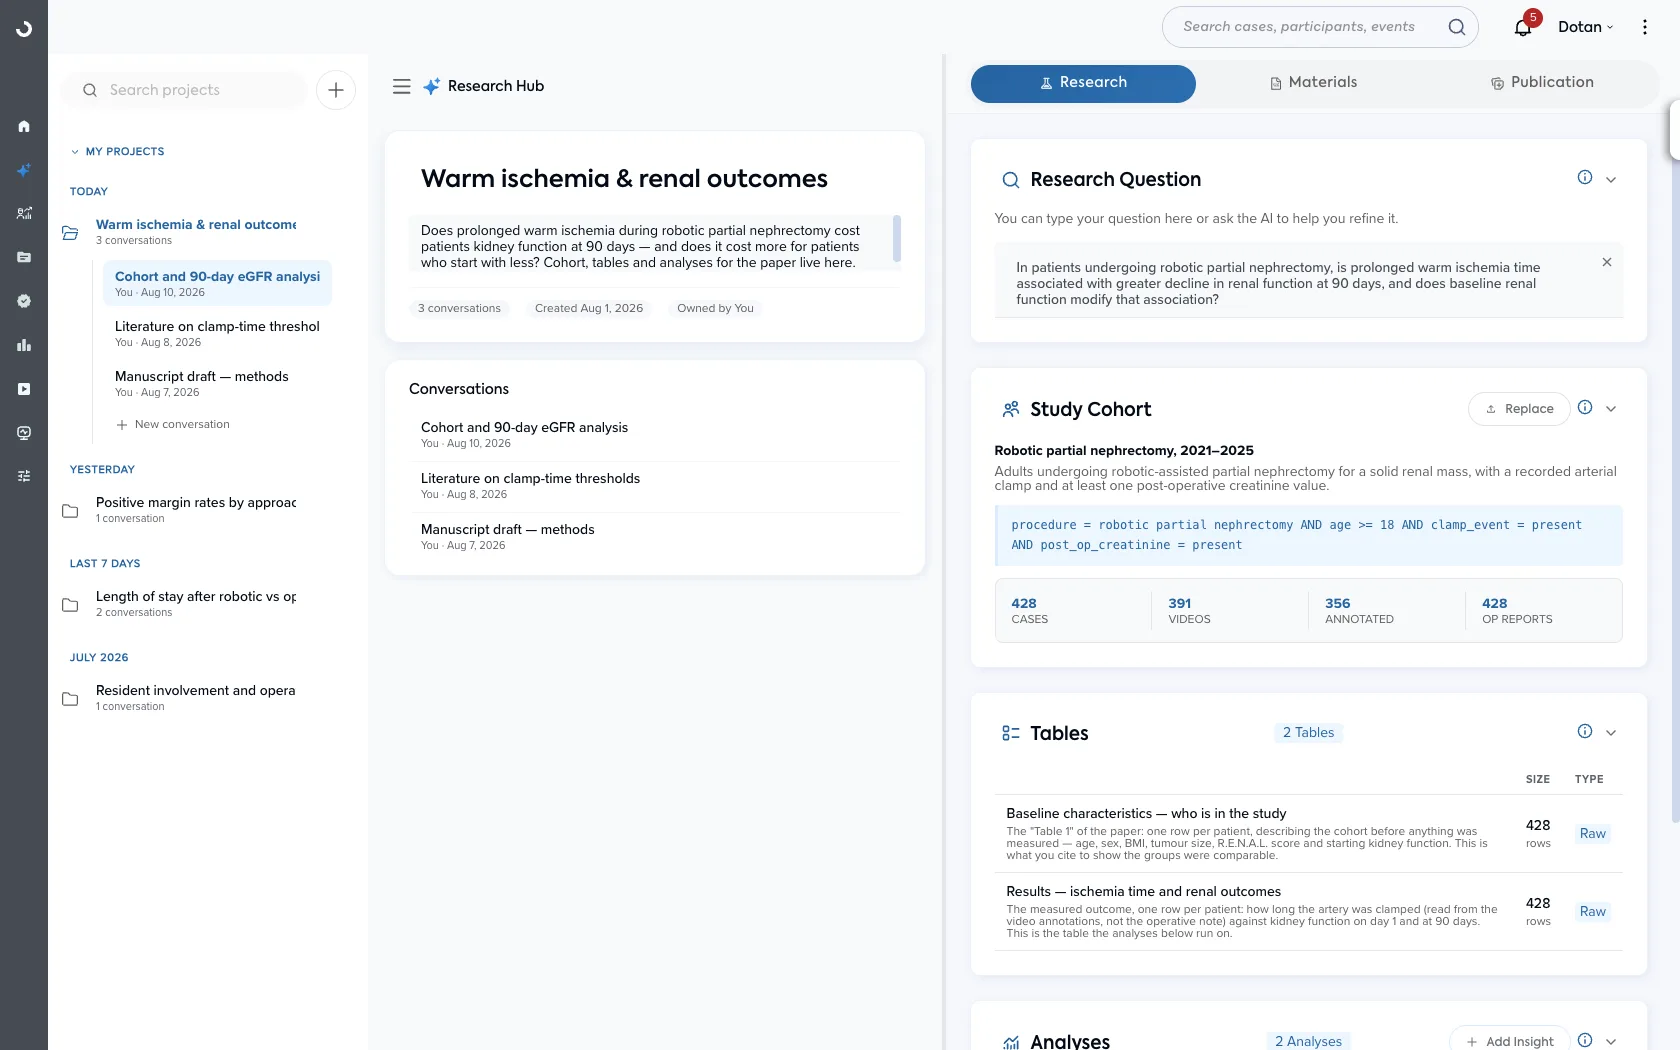
The Research tab: research question, study cohort with real case counts, derived tables and the analyses that run on them.
From Months to Minutes
When an Iteration Is Cheap, More Questions Get Asked.
Months
Pull the cohort by hand. Chase the labs. Re-extract when the criteria change. Wait on a statistician. Start over when a reviewer asks a new question.
Minutes
Ask in plain language. The cohort, the joined data, the statistics and the draft come back while you are still thinking. Change your mind and ask again — the iteration that cost a month now costs a sentence.
The Hub carries one continuous arc, not five disconnected tools.
One Continuous Arc
From Question to Manuscript, in One Project.
1
Question
Bring the clinical question, or shape one with the assistant. Everything that follows is anchored to it.
2
Cohort
Built from filters you describe or a list of case IDs, with counts of how many cases have video, annotations and operative reports.
3
Data points
The assistant proposes what to measure — including the guideline metric and the equivalent measure you did not ask for — then checks how many cases actually have each one recorded.
4
Analysis
Baseline table, group comparisons, regression, survival, power. Each records its method, test choice, result and clinical interpretation.
5
Article
A structured abstract, then a full manuscript written from the sources you selected — exportable as typeset PDF or LaTeX.
One study is one project. Several lines of inquiry run inside it against a single shared body of work — starting a fresh thread never costs you the study you already built.
One Collaborator, Four Disciplines
The Team a Study Needs, in a Single Conversation.
Data scientist
Builds the cohort from your cases, joins labs and outcomes, and derives the measures the study needs.
Biostatistician
Chooses the appropriate test, checks its assumptions, runs it, and reports the result properly.
Clinician
Knows what is clinically meaningful — interprets the numbers and flags the subgroup worth a second look.
Medical writer
Drafts in IMRAD structure, carries the citations, and formats the manuscript for submission.
You Stay the Researcher
It Brings the Reach, the Rigor and the Speed.
You Bring the Question and the Judgment.
Nothing is saved silently. Every time the assistant proposes a research question, a cohort, a table or an analysis, it comes as an approval card describing what is in it and why — you apply it or keep working on it. The workspace holds only what you approved, and the manuscript is written from what you selected.
The Output
A Manuscript Backed by Real Data.
Written, Not Templated
A full IMRAD manuscript drafted from your own findings. Edit it in place, or ask for a revision of any section.
Traceable
Every analysis records its method, test choice, result and clinical interpretation — so each claim in the paper points back to something you can re-open.
Submission-Ready
Export as a typeset PDF or LaTeX source, with the byline and collected references already in place.
What the Assistant Can Actually Do
Not a Chat Window Over a Dashboard.
The Research Hub runs real analysis on real tables, and shows you its work at every step.
Capability
What it does
Cohorts
Built from filters you describe — procedure, venue, surgeon, department, date range — or from a list of case IDs you upload. Case counts are real totals, with the number of cases carrying video, annotations and operative reports shown alongside.
Surgical data
180+ procedure types are supported across the platform, and 21 of them are modelled to step-level depth — spanning general surgery, urology, gynecology, thoracic, bariatrics, colorectal, ENT and ophthalmology. Each annotation carries its clinical meaning, its tagging rules and its supporting references.
Data-point selection
Before anything is built, the assistant proposes what to measure and marks one recommendation per outcome — alongside the guideline metric, the equivalent measure and the more direct measure. Then it reports how many cases actually have each one recorded, and revises the recommendation if the coverage does not hold up.
Statistics
Baseline "Table 1", two- and multi-group comparisons with automatic test selection (t-test, Mann–Whitney, ANOVA, Kruskal–Wallis, χ², Fisher), normality checks, correlation, linear and logistic regression, Kaplan–Meier with log-rank and Cox, contingency tables, and power and sample-size analysis.
Figures
Bar, line, scatter and box plots, plus cohort flow diagrams — produced on request and filed alongside the study.
Literature
Searched across the published literature and returned as saved references with year and type, kept with the study and carried into the manuscript's bibliography.
Your own files
CSV, XLSX and XLS load as working tables the assistant can analyze. PDF and DOCX are kept as reading material for context.
Exports
The article as typeset PDF or LaTeX source, workspace tables as files, and the conversation as Markdown or plain text.
Collaboration
Share a project with colleagues as Viewer or Editor. Everything the assistant produces is filed under the project and saved as you work.
One Illustration
Does Prolonged Warm Ischemia Cost Kidney Function at 90 Days?
It defined the cohort, derived ischemia time per case from the annotated clamp and unclamp events rather than the operative note, and compared 90-day renal decline across ischemia bands. Then it surfaced, unprompted, that the effect concentrates in patients who began with reduced function — and drafted the paper.
428
cases in cohort
19.4 min
median ischemia time
7.2 → 15.9%
90-day eGFR decline across bands
p < 0.001
Kruskal–Wallis across bands
Illustrative
This study, its cohort and every figure shown on this page come from the Research Hub's built-in guided tour, which runs on a synthetic sample dataset. No patient data appears.
Why It Matters
Better Research, Not Only Faster Research.
Less Selection Bias
Cases are captured continuously and automatically, so the cohort is drawn from a comprehensive, representative sample — not the subset someone remembered to log.
Objective Measurement
Intra-operative timings and events are read from the annotated video, removing the recall error baked into operative notes.
More Questions Asked
When an iteration costs minutes instead of weeks, the exploratory question and the subgroup check actually get run.